5.1 Correlate - correlation measures
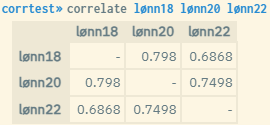
The command correlate is a tool for analyzing statistical correlations between variables. Values ranging from -1 to 1 are reported in a correlation matrix for the specified variables, where minus- and plus-values implicate negative and positive correlation respectively. The value 0 indicates no correlation. The closer to +/- 1, the stronger is the estimated correlation.
Syntax:
correlate <variable list> [if <condition>] [, <options>]
If no variable is specified, a correlation matrix for all variables in the dataset is presented.
The following options may be used to present alternative measures:
-
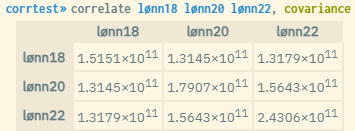
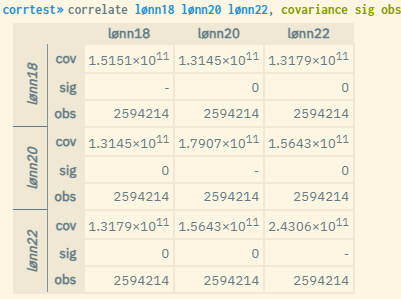
covarianceShow covariance instead of correlation coefficient -
pairwisePairwise presentation -
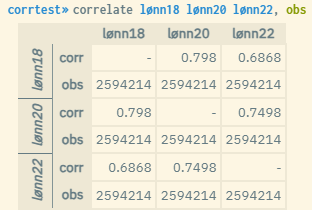
obsShow number of observations behind each correlation coefficient -
sigShow significance value for each correlation coefficient
Note: When displaying correlation values, the table will show a missing value where the same variable is measured against itself. This does not happen when displaying covariance values. The covariance where the same variable is measured against itself is indeed equivalent to the variance of this variable, and therefore relevant to show.
Examples ("lønn" = "yearly wage"):